Why SaaS Dashboard Numbers Do Not Match the Database
Hem Kant
·
27 Oct, 2026
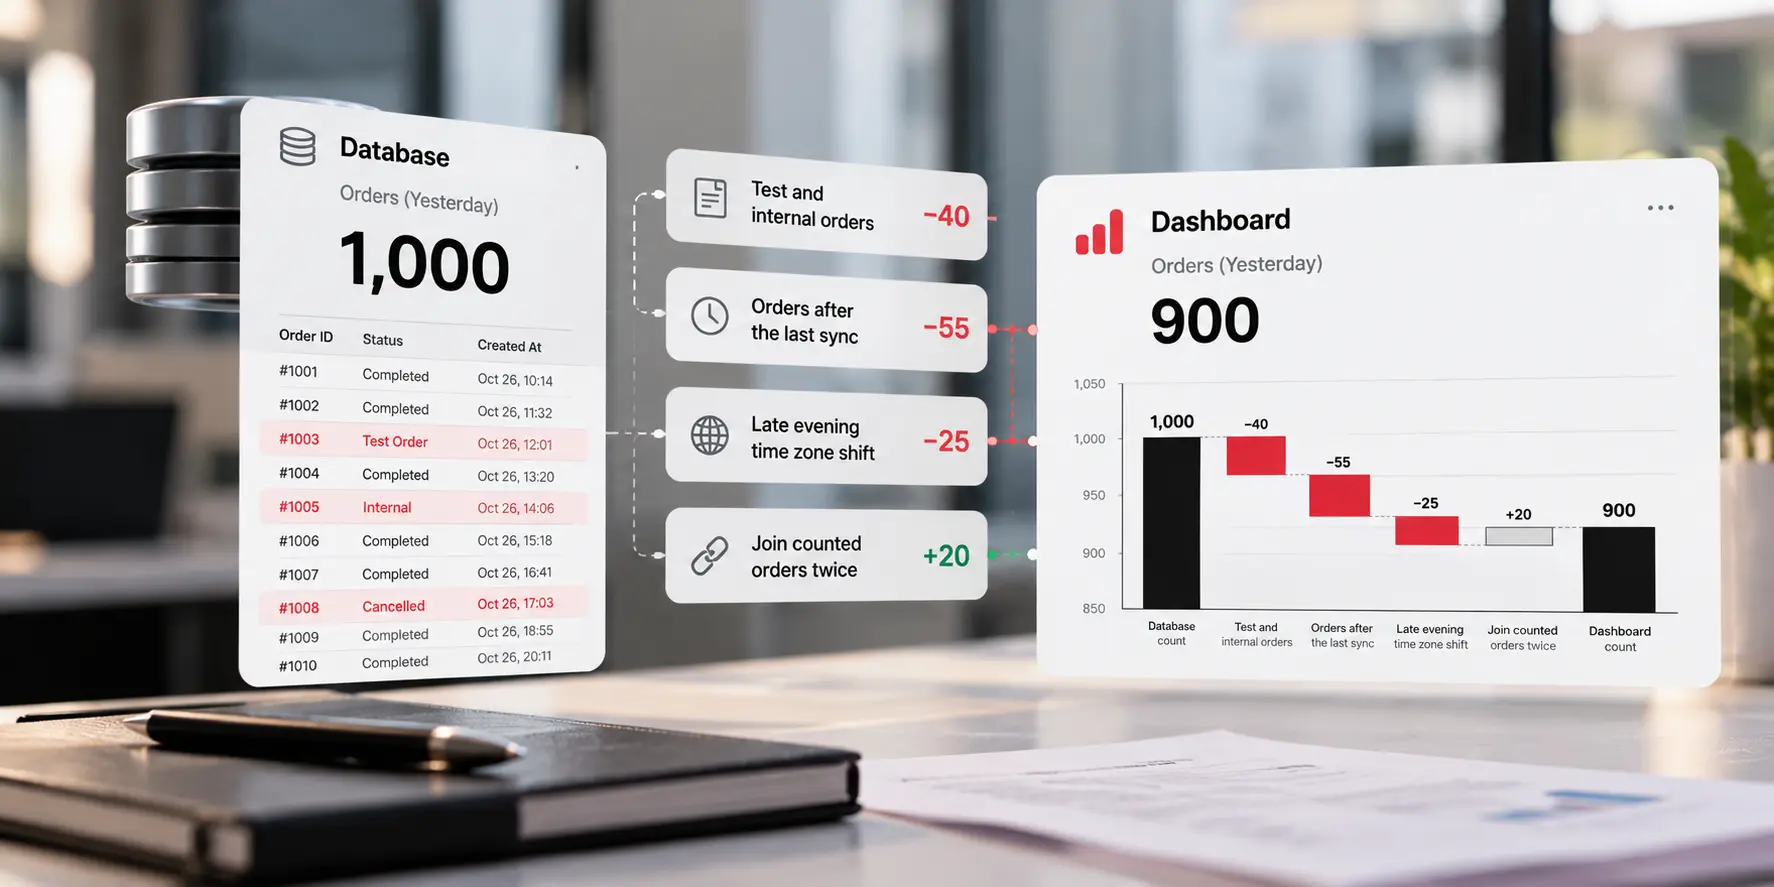
The email arrives at 8:40 on a Monday. “Your dashboard says 900 orders yesterday. Finance has 1,000. Which one is right?” Nobody on the team can answer in under an hour, and by then three people have opened three different tools.
Both numbers are usually right. They answer slightly different questions. In this we have explained why SaaS dashboard numbers do not match the database, lists the seven causes we see most often, and gives you a repeatable way to find the gap. We build data integrations at LN Webworks, so we have a stake in how this gets fixed.
A dashboard is not a window onto your database. It is a report built from a copy of it. The data moves from the application to a pipeline, then to a warehouse, then to a reporting tool. At each hop, someone chose a schedule, a filter, and a definition.
The shape of the gap tells you where to look. A small, steady difference is usually a definition or a filter. A gap that grows over time often points to sync timing or rows that were deleted. A sudden jump on a single day tends to be a bug or an outage. These are patterns from experience and not laws, but they save hours of searching.
| Cause | What it looks like | Quick Check |
| Different definitions | Gross against net revenue, or “active” meaning login on one side and purchase on the other | Write both definitions as one sentence each |
| Time window and time zone | Gaps cluster at day boundaries | Rerun both with the same zone and the same end date rule |
| Filters | One side includes test, trial, or internal accounts | Count excluded rows by type |
| Sync timing | Recent rows are missing from the dashboard | Read the last successful sync time |
| Deleted rows | The dashboard is higher than the database | List IDs that exist only in the dashboard |
| Join fan-out | Totals jump after adding a table to a report | Compare row counts before and after the join |
| Adding the wrong numbers | Rates, averages, or unique counts summed across days | Recompute from the base counts |
Sync timing. Pipelines run on a schedule. If yours runs every few hours, yesterday’s late orders may not have arrived when someone opened the dashboard. The same issue sits behind stale stock counts, as we describe in our piece on real-time inventory sync between ecommerce and ERP.
Deleted rows: Many incremental pipelines find changes by reading a modified timestamp. A row that is hard deleted has no timestamp to read, so it never reaches the warehouse as a change. The database loses the row, and the dashboard keeps it.
Time zones: One system stores time in UTC and another shows local time with no label. An order placed at 9 pm in New York lands on the next day in UTC. Each system is correct, and they put the order on different dates.
Adding the wrong numbers: A campaign with 100 impressions and a 10% click rate sits next to one with 900 impressions and a 20% rate. The combined rate is 19%, since 10 plus 180 clicks make 190 clicks out of 1,000. Averaging the two rates gives 15%. Unique counts break the same way. The same user is counted again on each day you add up.
Resist the urge to debug the pipeline first. Most mismatches are two correct numbers measuring different things, so rule out the cheap explanations before the expensive ones.
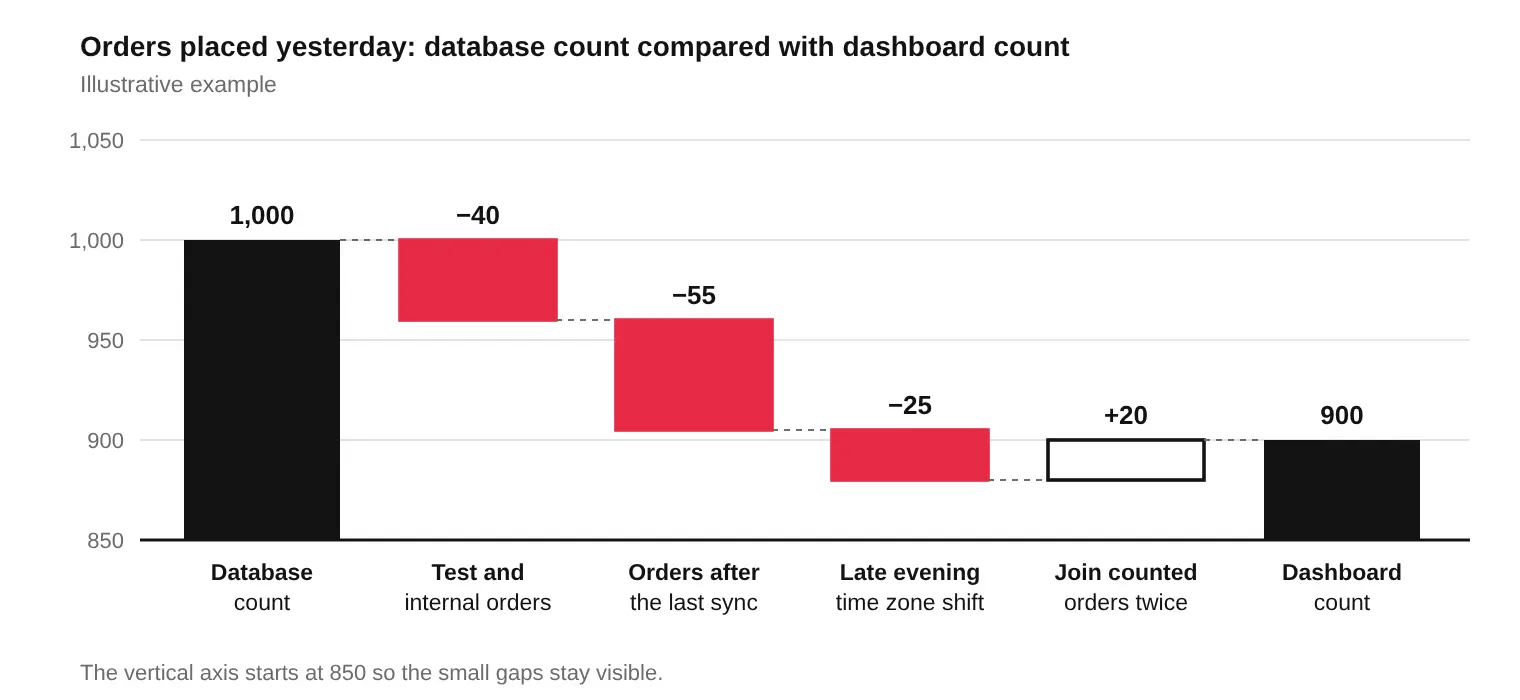
Notice that the chart moves in both directions. One cause adds orders while three remove them. That is why a gap of 100 can hide four separate problems, and why fixing one cause can make the total look worse before it looks better.
Editing a dashboard to match another number removes the symptom and keeps the disease. Three habits remove the cause:
If the pipeline itself is the weak point, because it drops, deletes or refreshes too rarely, that needs engineering work.
Not every gap needs fixing. A one or two percent difference from a known sync delay is a choice, as long as it is documented and stable. Test accounts excluded on purpose are a choice too.
A gap is a bug when it grows, when it jumps on a single day, or when nobody can explain it. Give each bug an owner and a date. An unexplained gap that nobody owns is the one that ends up in front of the board.
The fix for this problem is not a new tool. It is a ten-minute habit. Every Monday, pick one headline number and run the six steps on it. Write the result in a shared log, even when the answer is that nothing is wrong.
After a month, you know which numbers you can trust, which need work, and who owns each one. The Monday email gets shorter, and then it stops arriving.
Write your most argued-about metric in one sentence. Include every qualifier, then tell us where each team reads it. We will trace where the number changes on its way from the database to each report, and tell you what to fix first.
Our platform support team keeps these checks running once they are in place. Book a Discovery Call →
Why does my dashboard show different numbers than my database?
Usually because the two measure different things. A dashboard reads a copy of your data that passed through a pipeline, a warehouse, and a reporting tool. Each step can change the timing, the filters, the grain, or the definition. Check definitions and time windows first, then sync timing, then the pipeline itself.
How do I find out why two numbers do not match?
Write the metric as one sentence with every qualifier, match the time window and time zone, and compare row counts at the same grain. Then split the gap by day, plan, or region until it shrinks to a few rows, and compare those rows directly.
Can a time zone difference change a daily count?
Yes. An order placed at 9 pm in New York is stamped the next day in UTC. If the database groups by UTC date and the dashboard groups by local date, each system assigns that order to a different day. Totals for a month barely move, but daily numbers can differ by several percent.
Why does my dashboard show more records than the database?
Common causes are deleted rows the pipeline never removed, a join that repeats a row for each related record, and append-only tables that keep every version of an updated row. Compare record IDs on both sides to see which rows exist only in the dashboard.
How often should dashboards be reconciled with the source?
Check your handful of headline numbers weekly or monthly, and always after a change to the pipeline, the schema, or a metric definition. Automate the check for numbers that drive money or reporting to leadership.
Is a small difference between two systems acceptable?
Yes, if it is stable, explained, and written down. A gap of one or two percent from a known sync delay is normal. A gap that grows, jumps on one day, or has no explanation is a bug or a missing definition and needs an owner.

 Higher Education, Platform Strategy, Systems Integration
Ask an IT director at a growing university what breaks when they try to unify their systems, and the answer rarely starts with the software. It starts with a department that will not adopt the new standard, a data-sharing agreement nobody wants to sign, or a budget line that funded the project but not what […]
 Healthcare Technology, Systems Integration
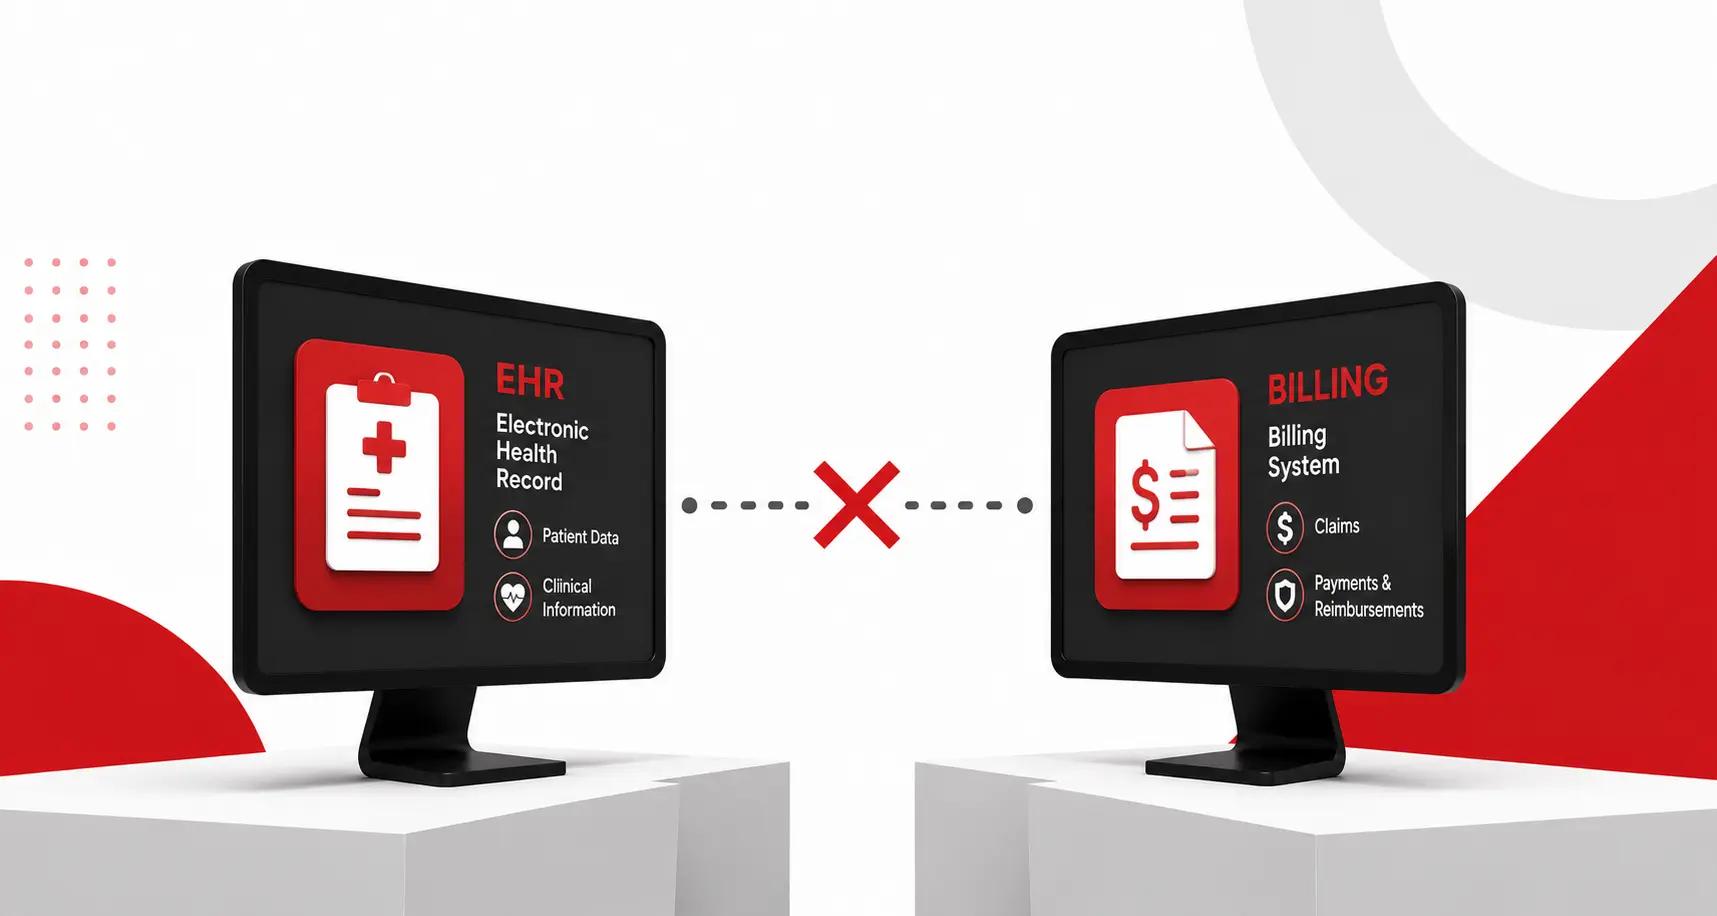
Most explanations for why an EHR and a billing system do not talk to each other assume the problem is a bad integration, a vendor that cut corners, or a connection nobody maintained properly. That framing is usually wrong. The real reason is more fundamental, and once you see it, the recurring billing errors, the […]
 API Strategy, Platform Strategy, SaaS Development, Systems Integration
An enterprise deal usually gets signed by the people least equipped to know whether it is technically achievable. That is not a criticism of sales; it is how the roles are supposed to work. But a contract that promises a specific integration timeline, a specific uptime guarantee, or a specific data migration, without engineering confirming […]