Why Do Your DORA Metrics Look Better Than Your Team?
LN Webworks
·
03 Sep, 2026
DORA metrics have been the closest thing software engineering has to an agreed-upon scoreboard, built on research spanning more than 39,000 professionals since 2014.
For most of that history, a team’s deployment frequency and lead time genuinely tracked how capable that team was.
AI coding tools quietly broke that relationship, and most engineering leaders reading their dashboards right now have not adjusted for it yet.
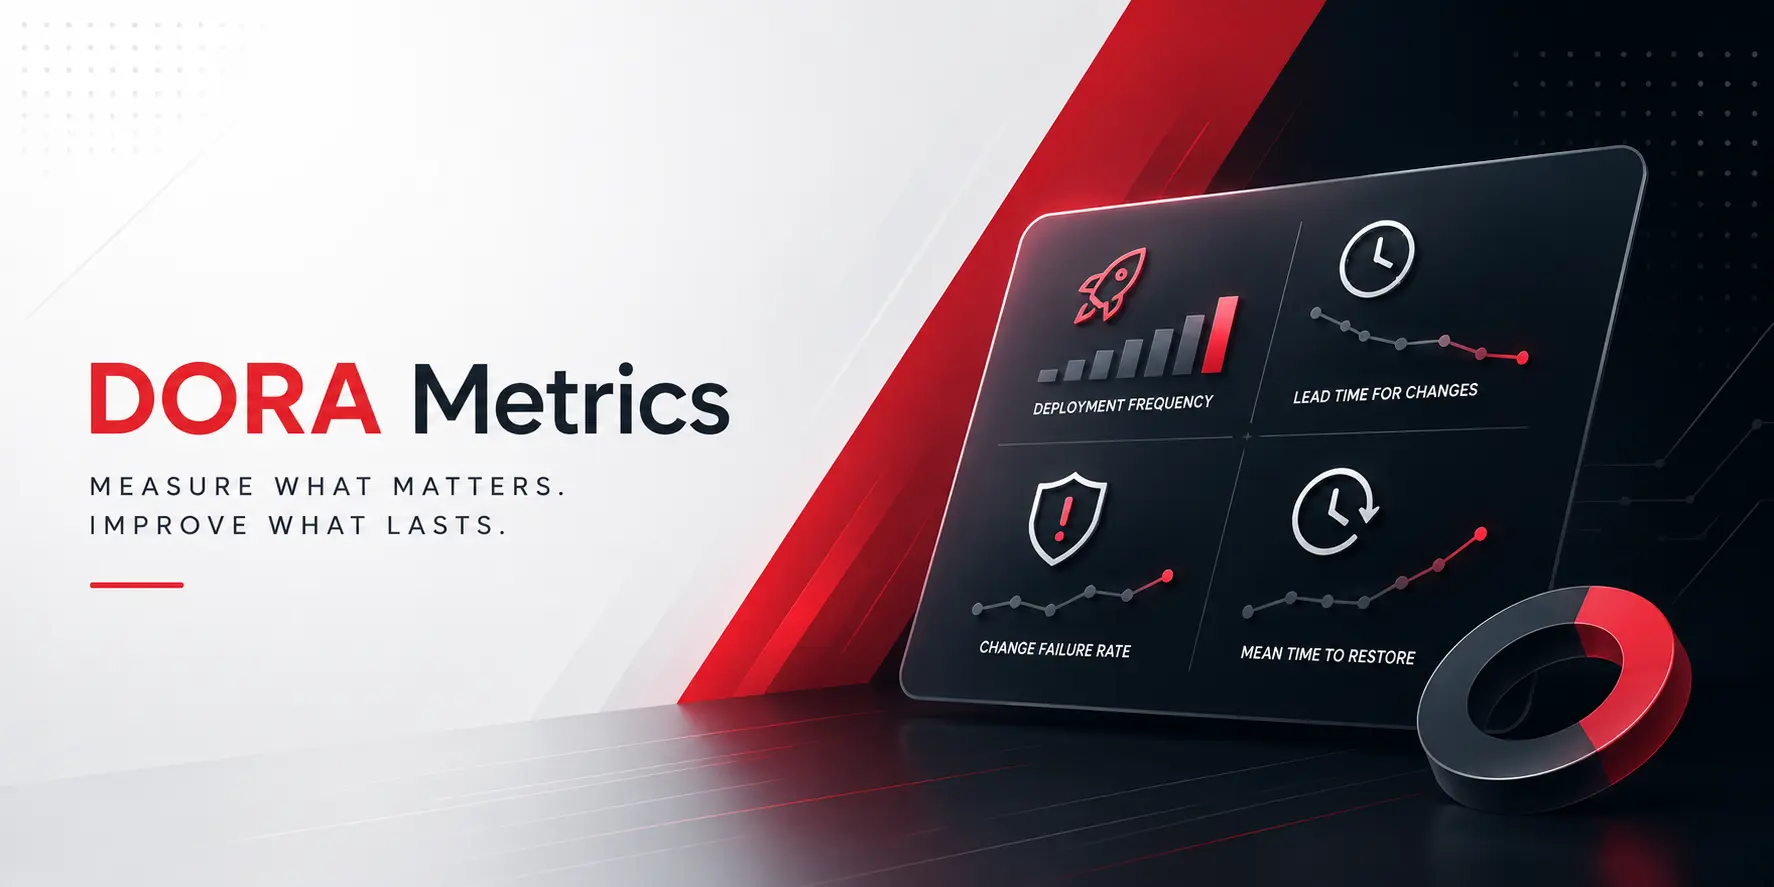
| Metric | What It Measures | Category |
|---|---|---|
| Deployment Frequency | How often the team releases to production | Throughput |
| Lead Time for Changes | Time from commit to running in production | Throughput |
| Change Failure Rate | Percentage of deployments causing a production failure | Stability |
| Mean Time to Restore | How long it takes to recover after an incident | Stability |
The discipline behind the model has always been that these four move together.
A team is not actually improving if throughput climbs while stability quietly erodes. That discipline is exactly what AI-assisted development is currently testing.
Consider a documented pattern from current DORA-adjacent research: a team deploying five times a week before adopting AI coding tools now deploys twenty times a week.
By the standard DORA benchmark, that is a jump from medium to elite performance.
But if fifteen of those additional twenty deploys are AI-generated boilerplate and configuration changes, the team has not become three times more capable.
It has become faster at shipping low-complexity work, and the metric cannot tell the difference on its own. Lead time shows the same distortion: when AI generates code in seconds, the coding phase of lead time collapses toward zero, and the resulting drop reflects the speed of code generation, not the health of the delivery pipeline around it.
This is not a hypothetical concern. DORA’s own current research finds that AI can improve documentation, code quality, and review speed, but can also coincide with lower delivery throughput and stability once the full picture is measured, not just the two metrics that are easiest to inflate.
It is the same underlying pattern we described in is vibe coding safe for production software: activity increases faster than the governance and review discipline needed to keep that activity trustworthy, and the dashboard looks great right up until it does not.
| EASY TO INFLATE
Deployment Frequency + Lead Time Count activity and speed. AI-generated boilerplate moves both without requiring real engineering judgment. |
HARD TO FAKE
Change Failure Rate + Mean Time to Restore Depends on whether the code actually works and how fast a team recovers when it does not. Neither improves just because code got written faster. |
If deployment frequency and lead time are climbing while change failure rate and mean time to restore stay flat, or get quietly worse, that gap is the tell. Speed increased. Capability did not, at least not by the same margin the dashboard implies. A team genuinely getting better shows improvement across all four metrics together, not just the two that are easiest to move.
The teams achieving genuine elite performance, deploying multiple times a day with lead times under 24 hours while keeping failure rates and recovery times low, are not doing it through raw tooling spend.
They are doing it through a disciplined, unglamorous combination: trunk-based development with small, continuous changes instead of large infrequent ones, feature flags that decouple deploying code from releasing it to users, and deployment strategies like canary or blue-green rollouts that contain the blast radius when something does go wrong.
That is the discipline we build into how we approach DevOps and deployment automation, since none of it is new advice. What changed is that AI-assisted development makes it easier than ever to hit impressive throughput numbers without any of that discipline underneath them, which means the discipline now has to be verified deliberately rather than assumed from the dashboard.
CI/CD itself is no longer a specialized concern either. Roughly 83% of developers now report direct involvement in DevOps-related work, based on research spanning more than 150,000 developers. The pipeline is mainstream. Reading its output honestly is the part still catching up.
If your deployment numbers have improved and you are not entirely sure whether that reflects your team or your tools, that distinction is worth checking before it shows up as an incident instead of a metric. B
Talk with us and we will help you read your own pipeline honestly.

 Build vs. Buy, Software Development, Web Development
Ask five agencies what a custom software project costs and you will get five variations of it depends. Technically, they are all correct. Practically, it is a useless answer to give someone trying to plan a budget, get a proposal approved, or figure out whether they are even in the right conversation before spending a […]
 AI & Automation, Digital Marketing
Key Takeaways Adoption is not the problem. One 2026 B2B survey found about 95% of marketers use AI, yet only about 39% said it improved performance. The tool is rarely the cause. Teams buy licenses first and decide the jobs later, with no number to judge the result. Sort tasks before you automate them. Ask […]
 Compliance & Governance, Engineering & Architecture
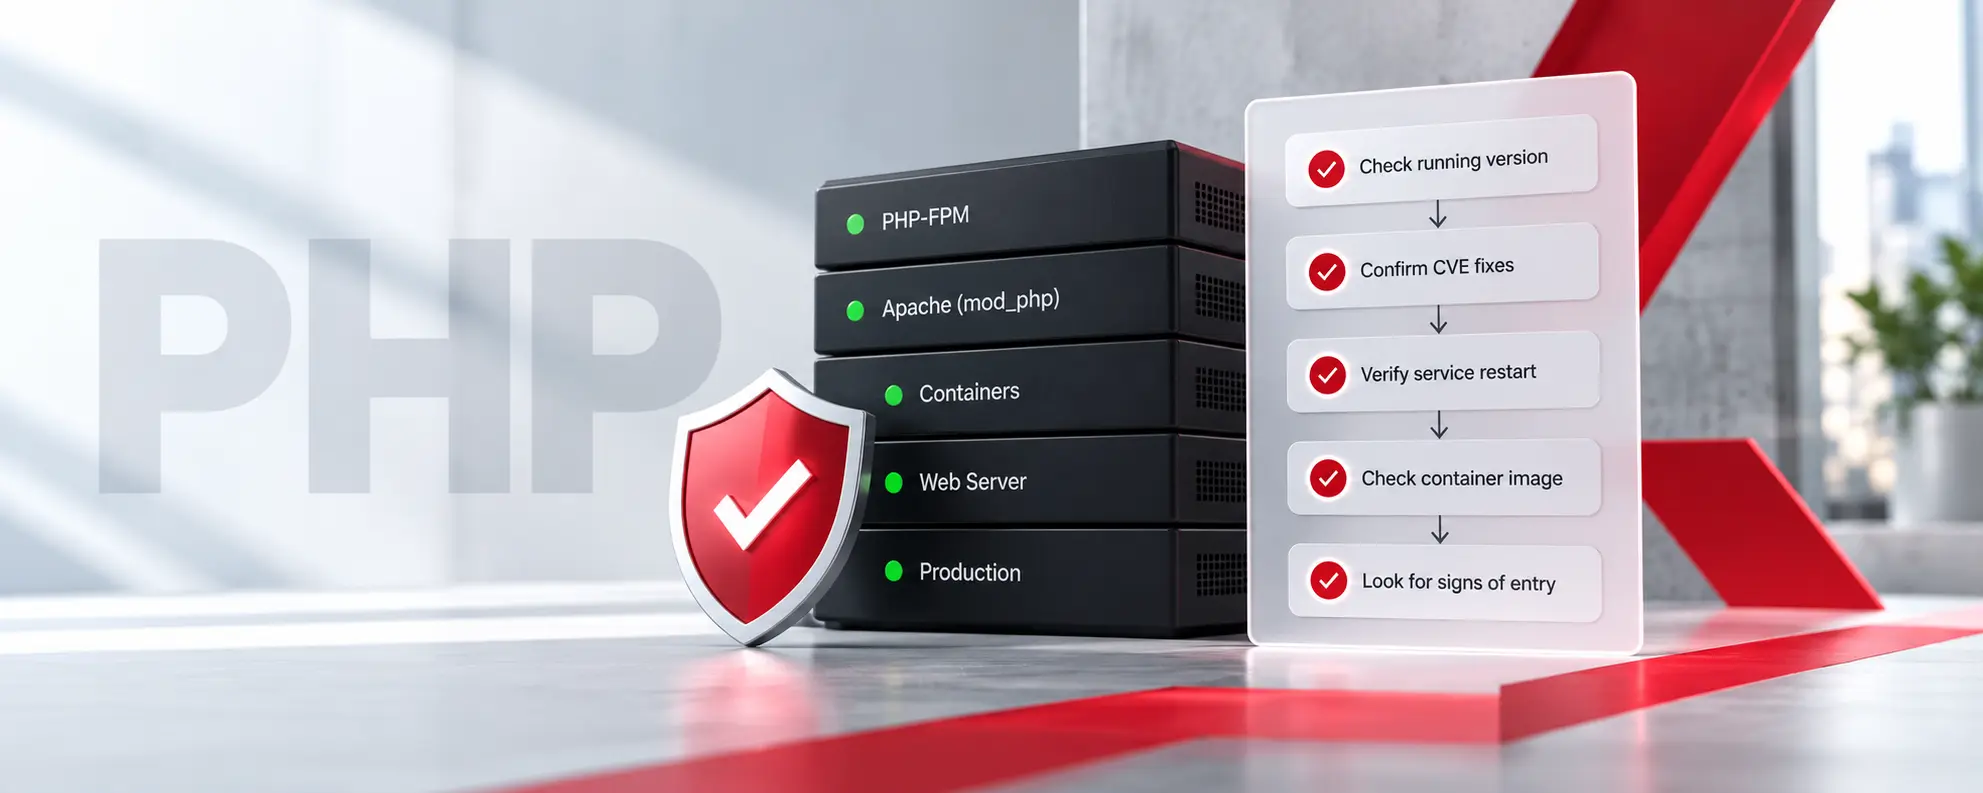
Key Takeaways Installed is not running. A new PHP package does nothing until the web server or the PHP-FPM workers restart. Check the PHP that serves traffic. The command-line version, the web server version, and a copy bundled inside an application can all differ. Version numbers can mislead. Linux vendors often backport fixes without changing […]