Why Your Website Is Slow Even After Optimization?
Hem Kant
·
09 Feb, 2026
If you’re still asking why my website is slow even after serious website performance optimization, you’ve probably noticed something frustrating: most advice starts repeating itself.
– Compress images
– Minify JavaScript
– Use a CDN
– Reduce requests
You did all of that. And the site still feels slow.
At that point, the problem is no longer performance basics. It’s how modern browsers, frameworks, and product decisions interact in ways most guides never really unpack, something we often see across broader common web development challenges.
This is often where teams realize performance needs to be addressed as part of the broader web development strategy, not as a last-minute fix.
This post focuses on those blind spots.
Most optimization advice still assumes the bottleneck is the network. That used to be true. In 2026, it’s often not.
On a modern site, especially one built with React, Vue, or similar frameworks, asset delivery is rarely the limiting factor. HTTP/2, compression, CDNs, and caching solve that reasonably well.
What actually dominates the timeline now and causes most website performance issues is JavaScript execution:
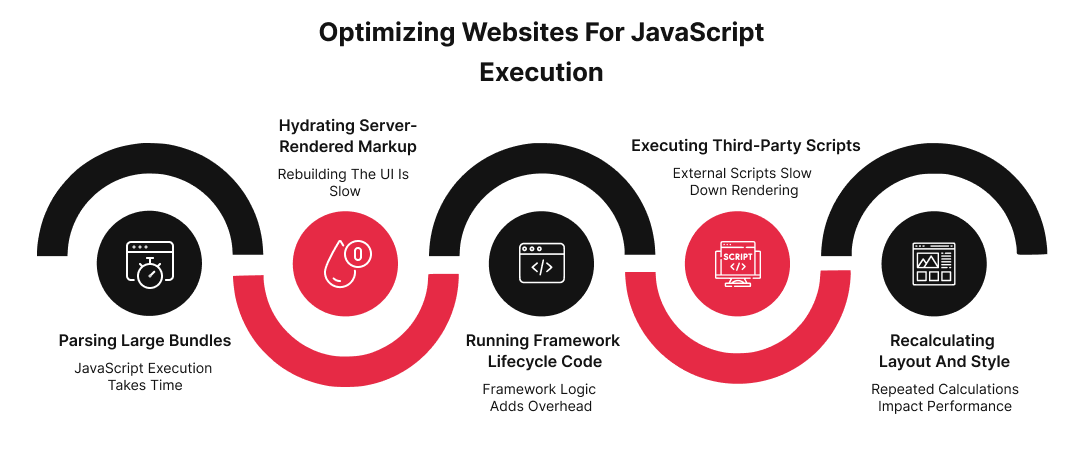
In simple terms, hydration is the step where JavaScript wakes up a visually complete page so clicks, inputs, and navigation actually work.
In real-world traces, it is common to see the browser finish downloading assets quickly and then spend seconds doing browser work before it can reliably respond to user actions.
This work happens on the browser’s main thread, the single lane responsible for rendering the page and responding to clicks, taps, and input.
We have observed that many teams assume they don’t have Core Web Vitals issues because Largest Contentful Paint (LCP) passes and Cumulative Layout Shift (CLS) looks stable. That assumption breaks down once you look beyond the initial load.
In practice, many performance problems show up:
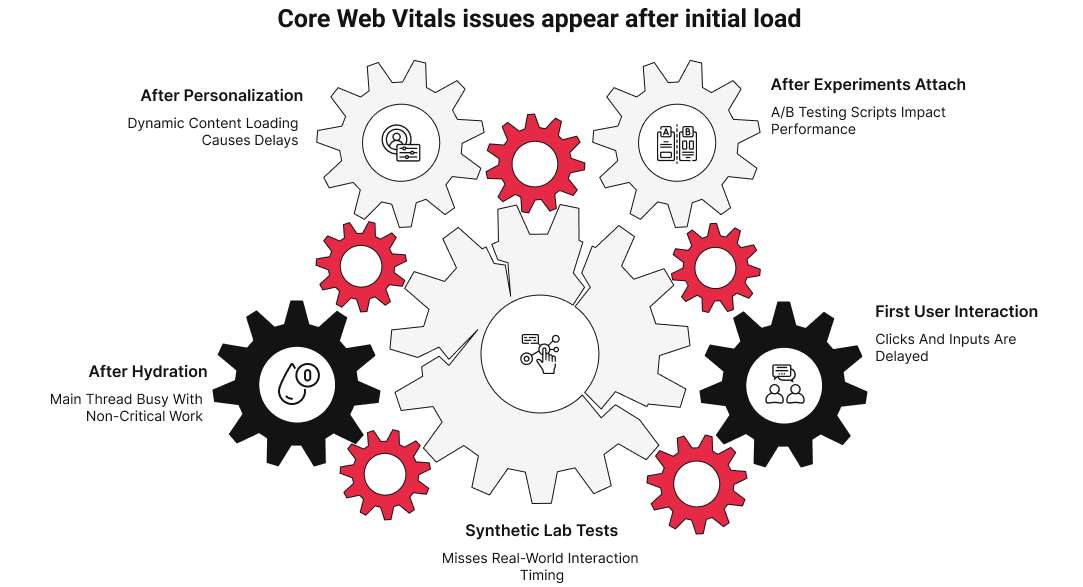
INP failures are especially common here, a metric that measures how quickly the site responds after a user interacts. The page looks ready, but the first click or input is delayed because the main thread is busy executing non-critical work.
From the user’s perspective, this is worse than a slow load. The site appears ready and then ignores them for a moment. That’s when trust drops, and you lose your prospect.
This is also why a standard website performance test or attempts to check the SEO performance of a website frequently miss the problem.
When teams debug frontend performance bottlenecks, they often look for the slow thing. In reality, the issue is more often how many things are allowed to run at once.
Observed common patterns in slow modern sites:
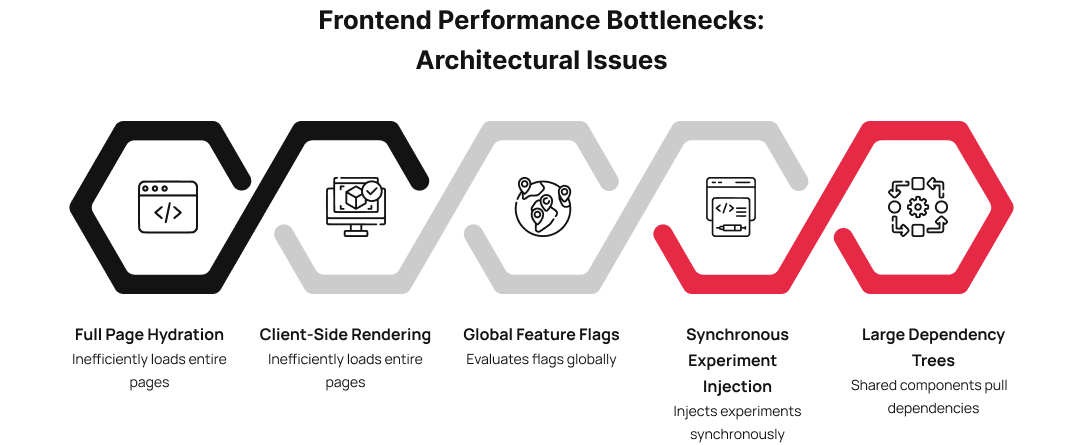
None of these choices are inherently wrong. They become expensive when they stack.
The browser doesn’t care that each piece is only a little slow. It only sees a saturated main thread. This is where performance becomes less about micro-optimizations and more about execution strategy.
One of the most under-discussed reasons why websites are slow today is third-party JavaScript.
Analytics, A/B testing, personalization, chat widgets, CRMs, these tools don’t just add requests. They add:
Across many real sites, third-party code accounts for 30–50% of main thread blocking time during critical interaction windows.
The problem isn’t that teams don’t know this or don’t know how to fix a slow website. It’s that they rarely have hard evidence about which scripts cause which delays. Without that, everything stays important, and nothing gets removed.
This is where disciplined analysis, the kind used in serious website audit services, actually matters: not as a service pitch, but as a way of thinking about performance as a system.
When optimization doesn’t stick, it’s usually not because your dev team stopped caring. It’s because technical debt in the website has crossed a threshold.
You can usually tell when this happens:
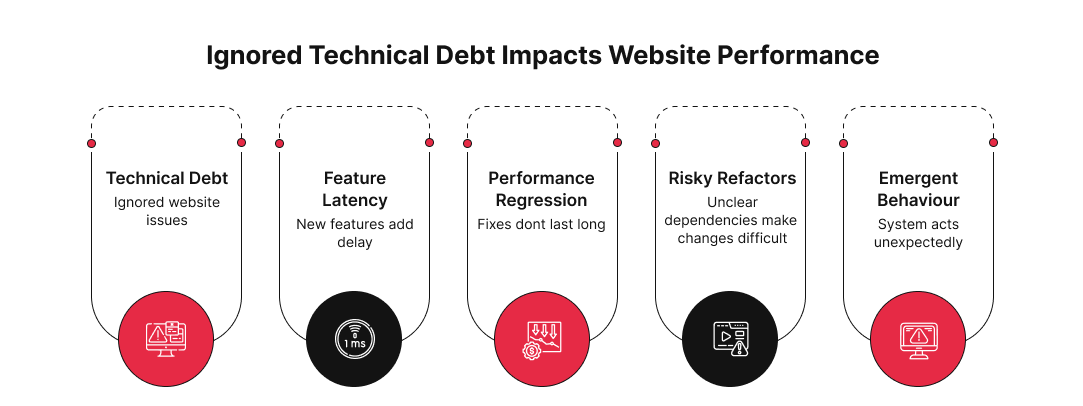
At that point, performance problems stop being isolated bugs and start being emergent behavior. The system is doing exactly what it was built to do, just not what you want anymore.
In 2026, website performance optimization fails when treated as a checklist instead of a diagnostic process. The biggest wins don’t come from smaller files or clever tricks. They come from answering questions like:
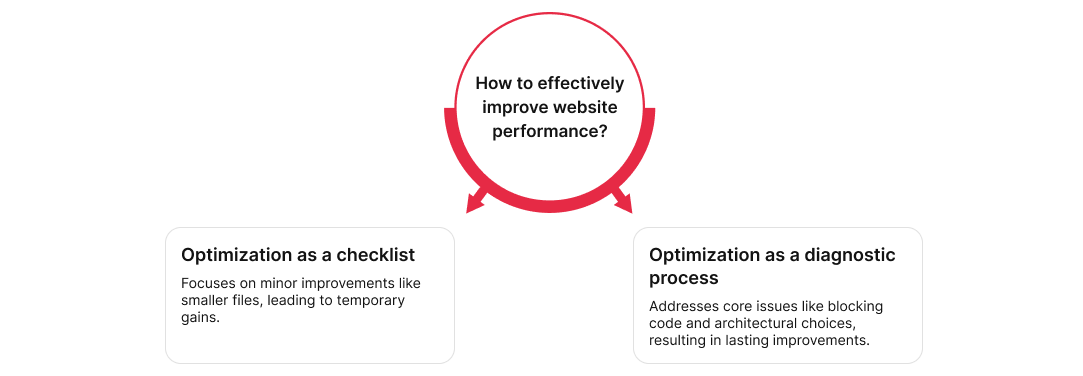
Until those questions are answered, performance work tends to be reactive and temporary.
If you are wondering why your website is slow even after doing everything right, the answer is rarely a single missing optimization.
It’s usually that:
Modern website performance is less about raw website speed tricks and more about intentional execution. If you’re caught in a loop despite doing the right things, it’s time for a second set of expert eyes.
Book your free website audit with our experts and uncover the exact issues slowing you down, so you can fix them with clarity.

 Other, SaaS Development
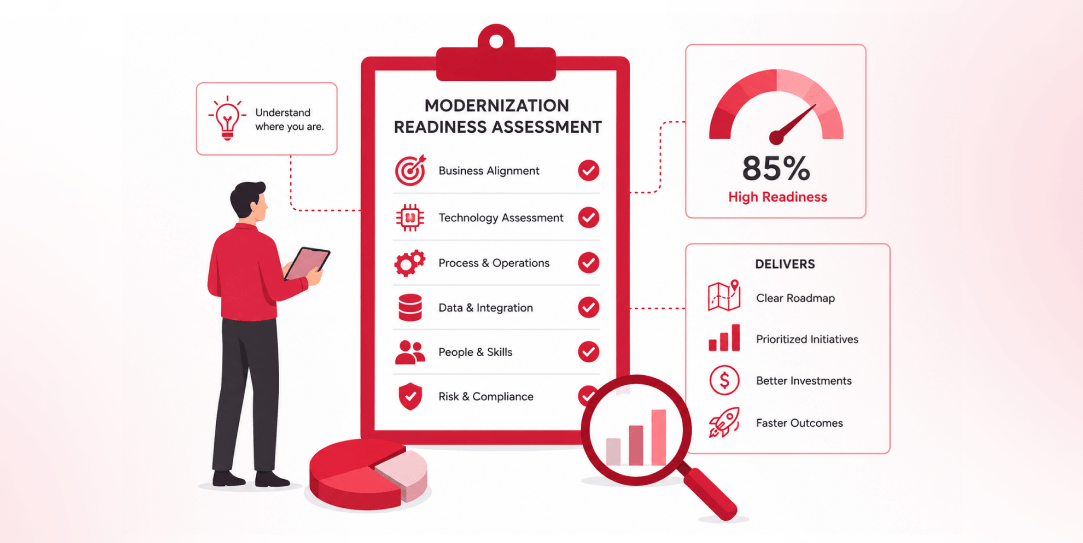
SaaS CRMs win on speed. Custom wins on fit and ownership. This isn’t a pitch for either one. Every early-stage SaaS company hits this decision within the first year, usually right after the founder realizes a spreadsheet isn’t a CRM. The default answer is almost always a SaaS CRM: HubSpot, Salesforce, Zoho, sign up in […]
 Other
Other
Most “audits” and “assessments” promise clarity but deliver a sales deck with language that lacks clarity. You book the call expecting evidence about your specific platform, and what shows up is a generic pitch for whichever package is easiest for the firm to sell. That’s the actual reason process transparency matters here, not because a […]
 Other
Other
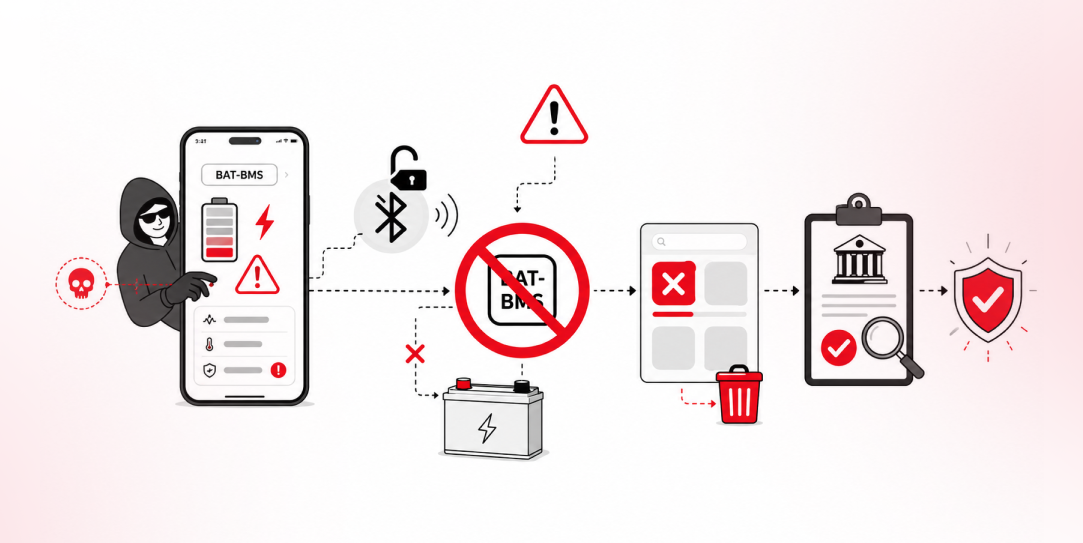
In late June and early July, videos started circulating on Instagram of people walking up to moving e-rickshaws, tapping a phone, and watching the vehicle lose power mid-ride. It spread as a prank trend before anyone fully understood the mechanism. Drivers in Patna (India) reported it first, assuming mechanical failure, until investigators traced it to […]