Mastering PHP Debugging: A Guide to Xdebug in Lando & DDEV for Drupal

Did you know that the first-ever computer bug wasn’t a piece of software code, but an actual moth? Now, let’s talk about something related but not quite as buggy – website development.
Debugging is like fixing problems in a website’s code. It’s important because it helps Drupal developers find and solve issues, making the website work better. To do this, you need the right tools. One handy tool for PHP (a programming language often used in web development) is XDebug.
In this article, we’ll share the steps and things you need to know to set up PHP debugging using XDebug. We’ll focus on using Lando and DDEV setups for Drupal. And to make things even better, we’ll be using the VS Code IDE (that stands for Integrated Development Environment). Let’s get started!
A Close Look at XDebug
XDebug is a powerful debugger that makes it easier for PHP developers to create a smooth functioning website. Here are some core features of it:
Step Debugging
Think of it as a methodical walkthrough of your code while the script is running. This feature enables developers to identify and address issues in real time.
Improved Error Reporting
XDebug maximizes PHP’s error-reporting capabilities. It provides enriched error messages, upgraded var_dump() functionality, and comprehensive stack traces for Notices, Warnings, Errors, and Exceptions. This enhancement facilitates a more efficient debugging process.
Tracing
When errors occur, XDebug generates meticulous stack traces, revealing the sequence of function calls leading up to the error. It also assists in tracking variable values during script execution, enhancing the understanding of value changes as the script progresses.
Setting up XDebug with VS Code
We chose VS Code here as it’s one of the most used and my favorite editors. Here’s a breakdown of how you can set up XDebug with VS Code:
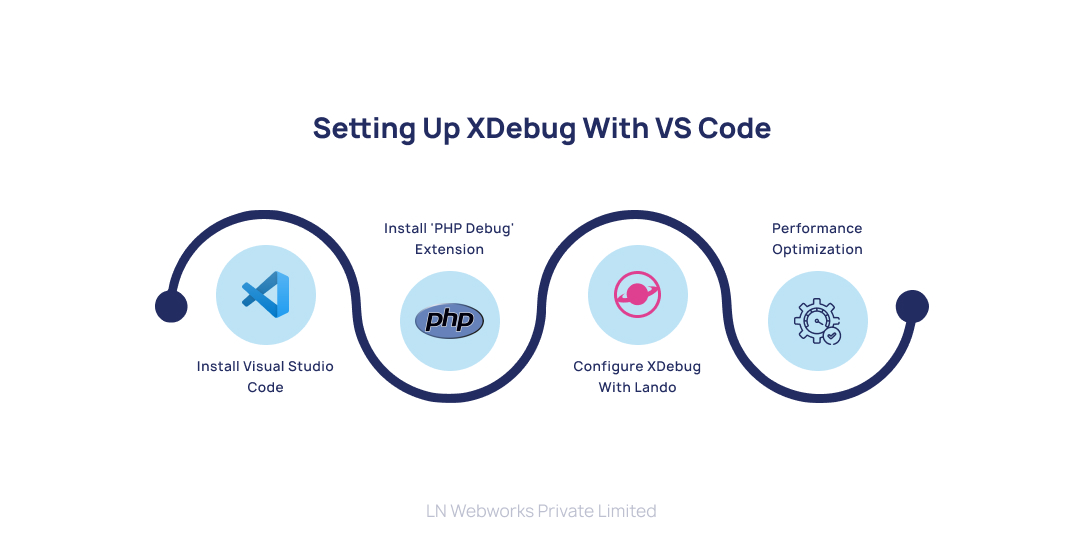
Install Visual Studio Code
If you haven’t already, download and install VS Code. It’s a popular choice among developers.
Install ‘PHP Debug’ Extension:
Go to the Extensions view in VS Code, search for ‘PHP Debug’, and install it. This extension is crucial for debugging PHP code, especially in projects using Lando or DDEV.
Configure XDebug with Lando
By default, Lando doesn’t have XDebug enabled. To enable it, add xdebug: true to your .lando.yml file under the config key:
name: TechX
recipe: drupal10
config:
xdebug: trueOr, if you prefer, you can override your PHP service by adding xdebug: true under appserver:
name: TechX
services:
appserver:
webroot: web
xdebug: true
After making these changes, rebuild your Lando environment:
lando rebuild -y
This ensures that XDebug is active whenever you start your Lando environment, ready to connect.
Performance Optimization
For better performance, consider toggling XDebug on and off based on your needs. You can achieve this with custom tooling commands.
Configuring Xdebug for VS Code
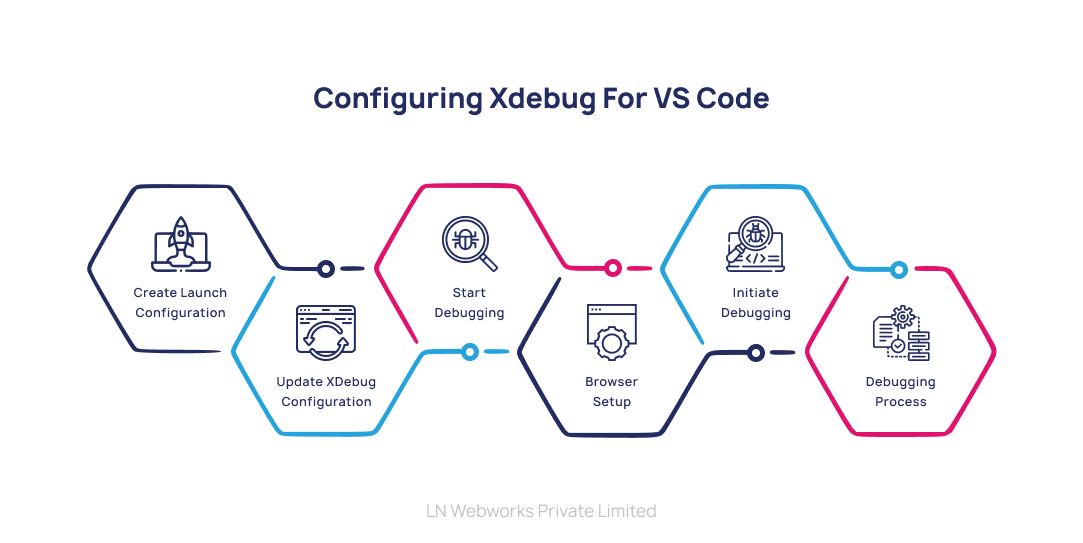
To make XDebug work seamlessly with VS Code, follow these steps:
Create Launch Configuration
- Open your project in VS Code.
- Navigate to ‘Run and Debug’ and select ‘create a launch.json file’.
- This action generates a launch.json file with default configurations.
Update XDebug Configuration
- Open the newly created launch.json file.
- Update the ‘Listen for Xdebug’ section with the following details. Note that XDebug 3 listens on port 9003.
{

    "version": "0.2.0",

    "configurations": [

        {

            "name": "Listen for Xdebug",

            "type": "php",

            "request": "launch",

            "port": 9003,

            "log": true,

            "externalConsole": false,

            "pathMappings": {

                "/var/www/html": "${workspaceFolder}"

            }

        }

    ]

}
Start Debugging
- Add breakpoints to your PHP code by clicking on the line number where you need them. Enable XDebug on Lando using:
lando xdebug-on
- In VS Code, go to ‘Run’ → ‘Start Debugging’. Ensure that “Listen for Xdebug” is selected (indicated by a green arrowhead at the top left).
- The bottom pane of VS Code should turn orange (live) and display “Listen for Xdebug”.
Browser Setup
- In your browser, open your Lando app’s URL.
- Look for the XDebug helper extension in the address bar (usually a “beetle” icon).
- Click on it and choose “Debug” from the menu to instruct your browser to send the necessary parameters to activate XDebug when a request is made.
Initiate Debugging
- Refresh the page or click on your site link.
- VS Code should automatically open the Debug window and display debug output if a breakpoint is reached.
Debugging Process
- When your code hits a breakpoint, the debugger halts, allowing you to inspect variables, step through code, and understand the flow.
- VS Code provides a user-friendly interface for interacting with the debugging session.
Let’s Wrap it Up!
In a snippet, mastering PHP debugging with XDebug in Lando and DDEV for Drupal simplifies the development process. This guide breaks down the setup, covering essential features like step debugging and error reporting. By integrating XDebug with VS Code and Lando, you gain a powerful toolkit for efficient debugging and an enhanced Drupal development experience.
To help you with this, reach out to our expert team of Drupal experts at LN Webworks. Our Drupal pros are always here to help you out and make your overall Drupal experience better
Author